Product Analytics
See how people use your agent, how reliable it is, and what it costs, from the runs Intelligence already records.
Open your coding agent in your project's folder, or in an empty folder for a new app.This runs in a coding agent on your computer.
Overview#
Product Analytics shows what people do with your agent, how reliable it is, and what it costs, from the agent runs Intelligence already records. There is nothing extra to instrument.
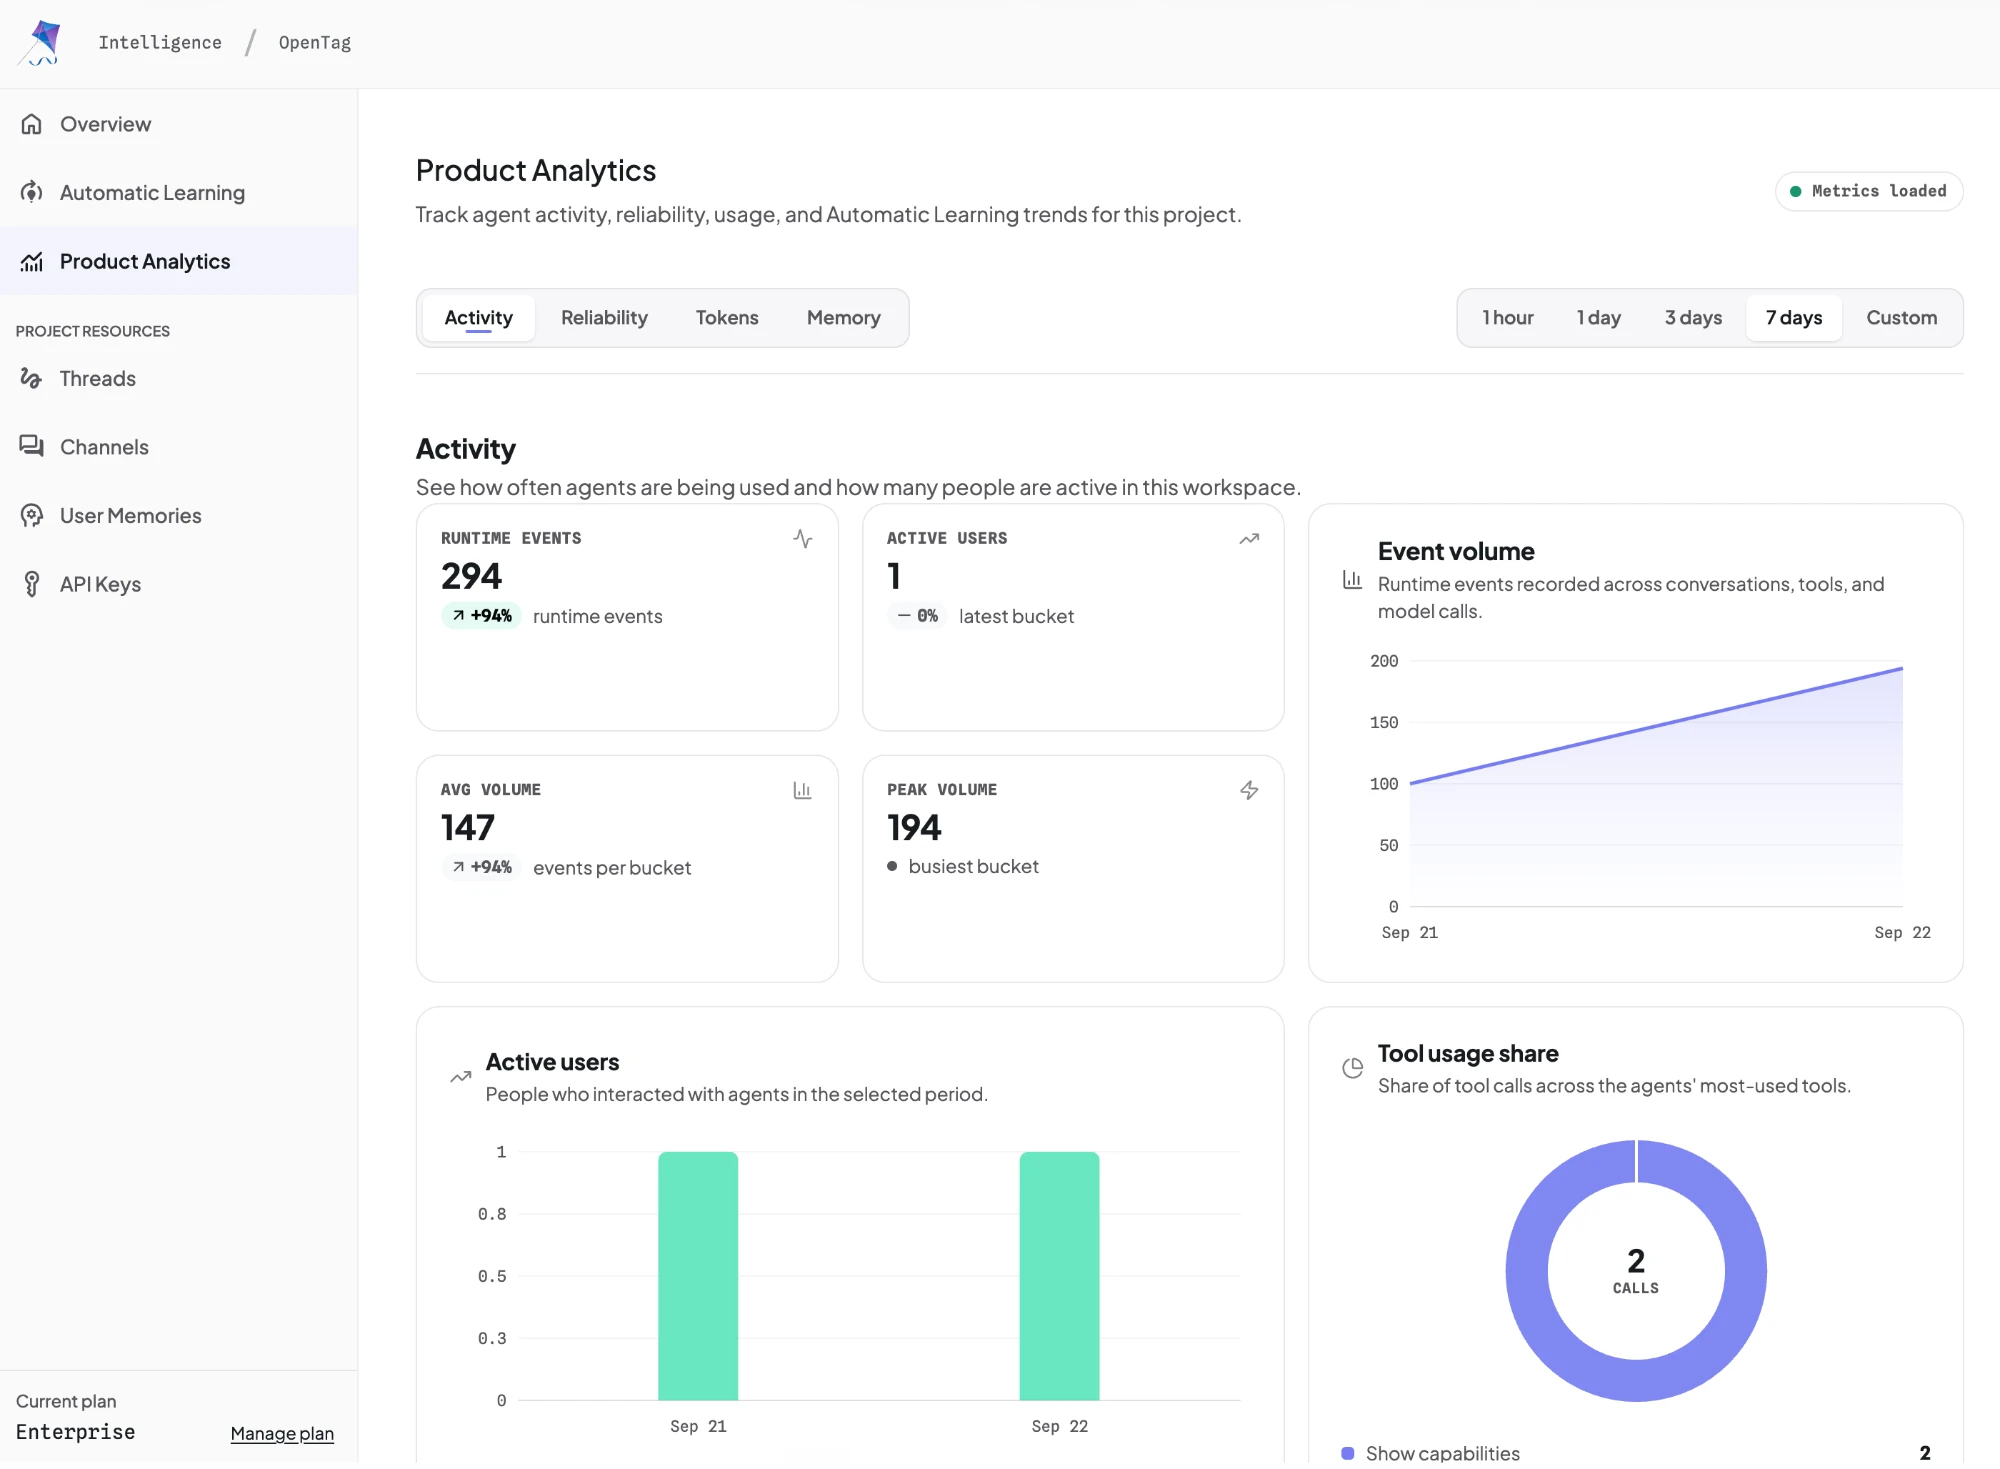
Which tools does the agent call? How many people use it? How often does a run fail? The Activity, Reliability, Tokens, and Memory tabs answer those questions for one project and one time range.
Product Analytics is available as a limited trial on Developer. Full Product Analytics is part of Enterprise. The project sidebar shows the features available to your plan; see the pricing page for current usage limits.
See your first metrics#
Connect your app#
Follow the quickstart. It signs you in with the CLI, selects a project, and writes the project key to .env. Product Analytics only counts runs that reach Intelligence through that key.
Send a few messages#
Use your app the way a person would: ask a question, trigger a tool, finish a conversation. Each run becomes a set of runtime events in the project. Confirm the run landed by opening the thread in AG-UI Streams or in the Inspector.
Open Product Analytics#
Open your project in cloud-hosted Intelligence and select Product Analytics in the sidebar. The status pill in the top right reads Loading metrics, then Metrics loaded.
If it reads No project metrics yet, no run has reached the project. The page shows a demo dashboard until one does.
Pick a time range#
Select 1 hour, 1 day, 3 days, or 7 days. Select Custom for a start and end time of your own. The range you choose applies to every tab. A range with no runs reads No data in this range.
Read the Activity tab#
Activity opens first. Four tiles summarize the range, and three charts show how it changed over time. The next section explains each one.
How Product Analytics works#
What gets counted#
Every agent run that goes through Intelligence produces runtime events: the run starts, messages stream, tools are called, the model responds, the run finishes or fails. Intelligence writes those events to a time-series store a moment after each run is accepted. Product Analytics queries that store for your project.
Two things are not counted:
- Threads you imported from another system. Only live runs produce runtime events.
- Runs that never reached Intelligence, such as a local app without a project key.
Runtime events are kept for 90 days. A range that starts earlier than that returns what is still stored.
Buckets#
Every chart groups events into buckets. The bucket size follows the range:
| Range | Bucket |
|---|---|
| 1 hour, 1 day, 3 days | Hourly |
| 7 days | Daily |
| Custom, up to 3 days | Hourly |
| Custom, longer than 3 days | Daily |
Tiles that say latest bucket or busiest bucket refer to those groups. The small percentage on a tile compares the last bucket in the range with the first one. A rising error rate is shown as a negative trend even though the number went up.
Tabs#
| Tab | Tiles | Charts |
|---|---|---|
| Activity | Runtime events, Active users, Avg volume, Peak volume | Event volume, runtime events per bucket. Active users, people who interacted with agents in the period. Tool usage share, calls per tool. |
| Reliability | Error rate, Error events, Tool calls, Clean runs | Error rate over time, normalized against total activity. Tool usage, most-used tools per bucket. Error share, clean runs versus runs with an error. |
| Tokens | Total tokens, Avg response, Peak response, Output tokens | Token volume, Response time, and Token split between input and output. |
| Memory | Created, Invalidated, Net new, Retention | Memory created, Memory invalidated, and Memory split per day. |
A few definitions:
- Active users counts distinct app users. Intelligence records the user ID your app passes with each run, so pass a stable ID per person. See Scope AG-UI Streams to the signed-in user.
- Tool usage share groups tool calls by tool name. The legend shows each name in words, so a tool called
show_capabilitiesappears as Show capabilities. - Error events are runs that ended with an error. Clean runs is the share that did not.
- Tokens and response time are recorded when a run finishes. Runs that fail before the model responds have no token count.
- The Memory tab reads User Memories rather than runtime events, so it reflects what memory saved and invalidated each day. The tab appears only when Automatic Learning is on for the project.
Status messages#
| The page says | What it means | What to do |
|---|---|---|
| Metrics loaded | Every metric returned data. | Nothing. |
| No data in this range | The store has events for the project, but none in this range. | Widen the range. |
| No project metrics yet | No run has reached the project. | Finish the quickstart and send a message. |
| Analytics isn't available for your role | Your role on this project cannot read analytics. | Ask a project admin for access. |
| Analytics is temporarily unavailable | The store did not answer. | Select Retry on the tile, or try again shortly. |
A tile that could not load shows N/A and a Retry button. Other tiles keep working.
Self-hosted deployments#
On cloud-hosted Intelligence, CopilotKit runs the analytics pipeline for you. A self-hosted deployment runs it inside your network. Turn it on in the Helm values:
analytics:
  enabled: true
  database:
    # A Secret that holds the TimescaleDB URL. Use sslmode=verify-full.
    existingSecret: intelligence-analytics-db
    secretKeys:
      url: timescale-url
  migrations:
    enabled: true
    # A schema-owner credential. Do not reuse the runtime credential.
    existingSecret: intelligence-analytics-db-owner
The chart passes the TimescaleDB URL to the app API and the realtime gateway and runs the schema migration as a Job. Your license must include analytics. Events are recorded for the whole deployment as soon as the pipeline is on, so the history is there when you open the page. The rest of the install is in the self-hosting guide.
Export to your own tools#
Product Analytics is a view inside Intelligence. The charts themselves are not exported.
A self-hosted deployment can send traces and product events, such as a thread created or a run requested, to an OpenTelemetry collector you run. Product events never contain message content. Monitor with OpenTelemetry lists each stream, what it contains, and how to turn it on.
Next steps#
- Open a thread in the cloud-hosted project to see the events behind one number.
- Automatic Learning turns the same runs into Skills you review and publish.
- Plans shows the limits that apply to your project.